이산확률분포인 베르누이 분포(Bernoulli Distribution)에 대해 알아본다.
개요
정의
한 번의 시행에서 성공 확률이 $p$이고 실패 확률이 $1−p$인 경우, $X$가 성공(1) 또는 실패(0)를 나타내는 확률 변수일 때, 확률 변수 $X$가 보이는 분포
특징
확률 변수 $X$는 베르누이 시행(Bernoulli Trial)을 표현하며 다음과 같은 특징을 가지고 있다.
● 두 가지 결과: 예(1), 아니오(0) 등
● 결과의 확률이 고정: 각 시행마다 성공 확률은 항상 일정
● 독립 시행: 특정 시행 결과가 다른 시행의 결과에 영향을 주지 않음
시행 횟수가 1 이상이 되면 이항분포(Binominal Distribution)가 된다.
핵심 파라미터 및 관련 수식
파라미터
● $P$: 확률
관련 수식
이산 확률 변수 $X$에 대한 확률질량함수(probability mass function)는 다음과 같다.
$$ f(k) = \begin{cases}\begin{align}
1 - p \quad & if \; k = 0\\
p \qquad & if \; k = 1
\end{align}\end{cases} \qquad
\text{for} \; k \; \text{in} \; \{0, 1\}, \; 0 \le q \le 1$$
분포
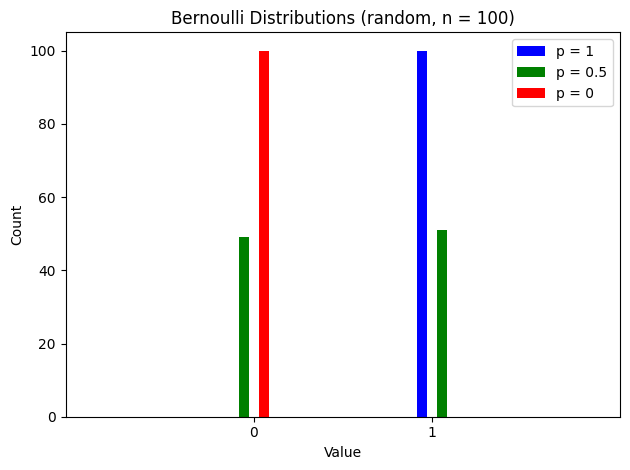
확률 $P$가 0, 0.5, 1인 경우의 분포는 다음과 같다.

기타
-
실습
베르누이 분포를 따르는 임의의 숫자를 생성하려면 다음과 같이 코드를 작성할 수 있다.
1
2
3
4
5
6
| import numpy as np
from scipy.stats import bernoulli
np.random.seed(123)
bernoulli.rvs(0.5, size = 10)
|
이론 부분의 분포를 그리기 위해 사용된 코드는 다음과 같다.
1
2
3
4
5
6
7
8
9
10
11
12
13
14
15
16
17
18
19
20
21
22
23
24
25
26
27
28
29
30
31
32
33
34
35
36
37
| import numpy as np
import pandas as pd
from scipy.stats import bernoulli
import matplotlib.pyplot as plt
np.random.seed(120)
r1 = bernoulli.rvs(1, size = 100)
r2 = bernoulli.rvs(0.5, size = 100)
r3 = bernoulli.rvs(0, size = 100)
r1_values = [sum(r1 == 0), sum(r1 == 1)]
r2_values = [sum(r2 == 0), sum(r2 == 1)]
r3_values = [sum(r3 == 0), sum(r3 == 1)]
bar_width = 0.05
spacing = 0.05
r1_pos = np.arange(2)
r2_pos = [x + bar_width + spacing for x in r1_pos]
r3_pos = [x + bar_width + spacing for x in r2_pos]
plt.bar(r1_pos, r1_values, color = "blue", width = bar_width, label = "p = 1")
plt.bar(r2_pos, r2_values, color = "green", width = bar_width, label = "p = 0.5")
plt.bar(r3_pos, r3_values, color = "red", width = bar_width, label = "p = 0")
plt.xlim(-0.8, 2)
plt.xticks([0.15, 1.05], ["0", "1"])
plt.ylabel("Count")
plt.xlabel("Value")
plt.title("Bernoulli Distributions (random, n = 100)")
plt.legend(loc = "upper right")
plt.tight_layout()
plt.show()
|


