Py) Stat - 선형회귀 결과 테이블 정제

Py) Stat - 선형회귀 결과 테이블 정제

Python의 statsmodels 라이브러리를 활용하여 선형회귀 분석을 실시할 경우 다양한 통계량이 산출되는 것을 볼 수 있다. 해당 값을 추출하는 방법을 알아보도록 한다.

단순히 분석 결과값을 눈으로 확인할 수 있긴 하지만 이를 자동화 하거나 시뮬레이션을 하려면 산출되는 모든 값을 뽑아서 별도의 객체에 저장해야 할 필요가 있다. 이 때 사용할 수 있는 접근 방법을 이번 포스팅을 통해 소개한다.

데이터 준비

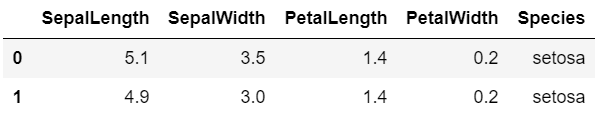
너무나도 유명한 “iris.csv” 로 실습을 하도록 한다.
iris.csv 다운받기 [클릭]

1
2
3
import pandas as pd
df = pd.read_csv("iris.csv")
df.head(2)

선형회귀 결과 확인

1
2
3
from statsmodels.formula.api import ols
model = ols("SepalLength ~ SepalWidth + PetalLength", data = df).fit()
model.summary()

대표 통계량의 접근

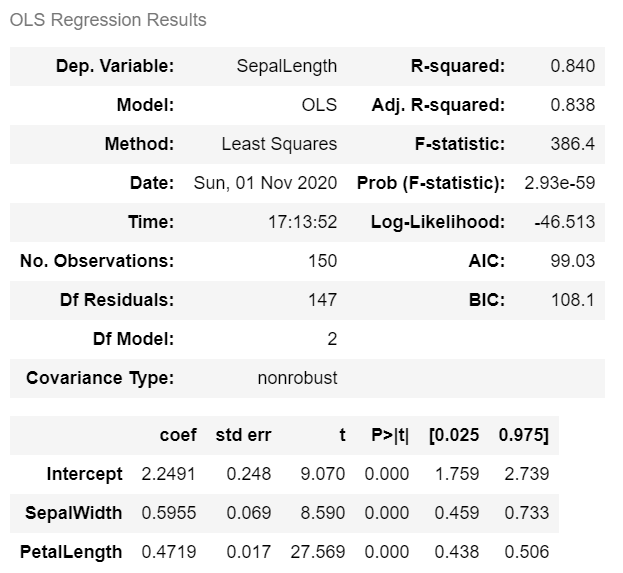
이제 model 객체에 있는 attribute를 살펴보자. 먼저 상단 첫 번째 테이블에서 주로 보는 통계량은 다음과 같이 뽑을 수 있다.

1
2
3
4
5
6
7
8
9
10
11
12
13
14
15
16
17
model.rsquared
## 0.8401778354262204

model.rsquared_adj
## 0.8380033842075295

model.fvalue
## 386.3861503097072

model.f_pvalue
## 2.933054345369183e-59

model.aic
## 99.02549981959152

model.bic
## 108.05740570188028

두 번째 테이블에서 볼 수 있는 변수 관련 상세 내용은 다음과 같이 추출할 수 있으며 가장 왼쪽에 있는 변수의 계수(coefficient) 부터 차례대로 나열하였다. 여기서 “params” attribute가 변수의 계수인데 이름이 직관적이지 않아 잘 모르는 경우가 많다.

1
2
3
4
5
6
7
8
9
10
11
12
13
14
15
16
17
18
19
20
21
22
23
24
25
model.params
## Intercept 7.038510e-16
## SepalWidth 1.163254e-14
## PetalLength 5.847914e-60
## dtype: float64

model.bse
## Intercept 0.247970
## SepalWidth 0.069328
## PetalLength 0.017118
## dtype: float64

model.tvalues
## Intercept 9.070224
## SepalWidth 8.589940
## PetalLength 27.569160
## dtype: float64

model.pvalues
## Intercept 7.038510e-16
## SepalWidth 1.163254e-14
## PetalLength 5.847914e-60
## dtype: float64

model.conf_int()

모든 통계량의 접근

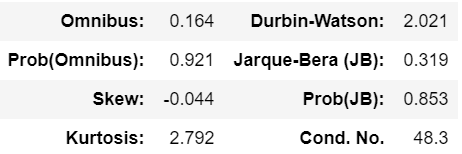
여기서는 모델 객체가 담고있는 단순 attribute가 아니라 우리가 눈으로보는 모든 값을 뽑아보고자 한다. 일단 다시 선형회귀 결과를 보자.

.summary() 메서드로 확인하는 결과에는 숫자가 많지만 세 번째 테이블의 내용을 뽑을 수는 없다. 그래서 그 결과를 별도의 객체에 할당하고 그 내용을 뽑아보려 한다.

1
2
model_summary = model_1.summary()
model_summary.tables[2]

해당 결과는 “tables” attribute에 담기는데 일단 위와 같이 상세 내용을 뽑아낼 수 있긴 하지만 다음과 같은 결과를 보여주어 쉽사리 값을 뽑을 수 없다.

1
2
3
4
5
model_summary.tables[2][1]
## [<statsmodels.iolib.table.Cell at 0x23148064e80>,
## <statsmodels.iolib.table.Cell at 0x2314806a2b0>,
## <statsmodels.iolib.table.Cell at 0x231480d1fa0>,
## <statsmodels.iolib.table.Cell at 0x231464240a0>]

※ SimpleTable 관련 내용은 여기에서 확인할 수 있다.

그래서 다음과 같이 우회를 하도록 한다.

1
2
3
4
5
model_summary.tables[0].as_html()
## '<table class="simpletable">\n<caption>OLS Regression Results</caption>\n<tr>\n <th>Dep. Variable:</th>
## <td> 0.840</td>\n</tr>\n<tr>\n <th>Model:</th> <td>OLS</td> <th> Adj. R-squared: </th> <td> 0.838<th>
## --- (중략)
## </th> <td> </td> \n</tr>\n<tr>\n <th>Covariance Type:</th> <td>nonrobust</td> <th>

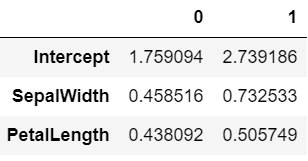
as_html() 함수를 사용하면 HTML 형식으로 출력되는데 이를 활용하는 방법은 두 가지가 있다. PandasBeautiful Soup 라이브러리가 바로 그 것이다. 아무래도 Pandas 를 사용하는 것이 상대적으로 라이브러리 의존도를 높이지 않는 방법이라 Pandas 예제를 먼저 알아보도록 하자.

1
pd.read_html(model.summary().tables[2].as_html())[0]

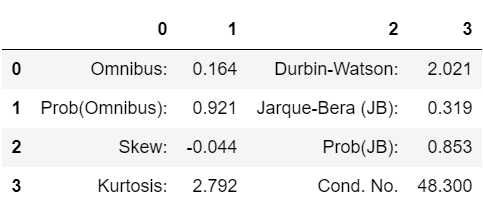
데이터프레임으로 변환하면 나머지 값의 접근은 별 문제가 없으니 위 코드를 활용하면 되겠다. 단, 코드 마지막에 있는 [0] 를 빼먹으면 데이터프레임이 list 안에 들어가있는 상태가 되기 때문에 빼먹지 말자.

Beautiful Soup 예제는 다음과 같으니 참고하도록 하자.

1
2
3
4
5
6
7
8
9
10
from bs4 import BeautifulSoup as bs
model_summary_bs = bs(model_summary.tables[0].as_html(), "html.parser")

model_summary_bs.caption.text
## 'OLS Regression Results'

model_summary_bs.find_all(name = "tr")[0]
## <tr>
## <th>Dep. Variable:</th> <td>SepalLength</td> <th> R-squared: </th> <td> 0.840</td>
## </tr>
Your browser is out-of-date!

Update your browser to view this website correctly. Update my browser now

×