R) 패키지 bbplot 소개

R) 패키지 bbplot 소개

CRAN RStudio mirror downloads

언론사 BBC는 데이터를 이쁘게 시각화 하는 것으로도 유명하다. ggplot2 패키지를 사용하다보면 본인의 입맛에 맞게 여러 부분을 수정하곤 하는데 BBC에서는 조직의 톤엔 매너(tone & manner)를 맞춰야 해서 그런지 이 것을 패키지로 만들어 공개하였다. 어떤 기능이 있는지 알아보도록 하자.

개요

bbplot 패키지 의 공식 페이지에는 상당히 이뻐보이는 예제 그래프를 보여준다.
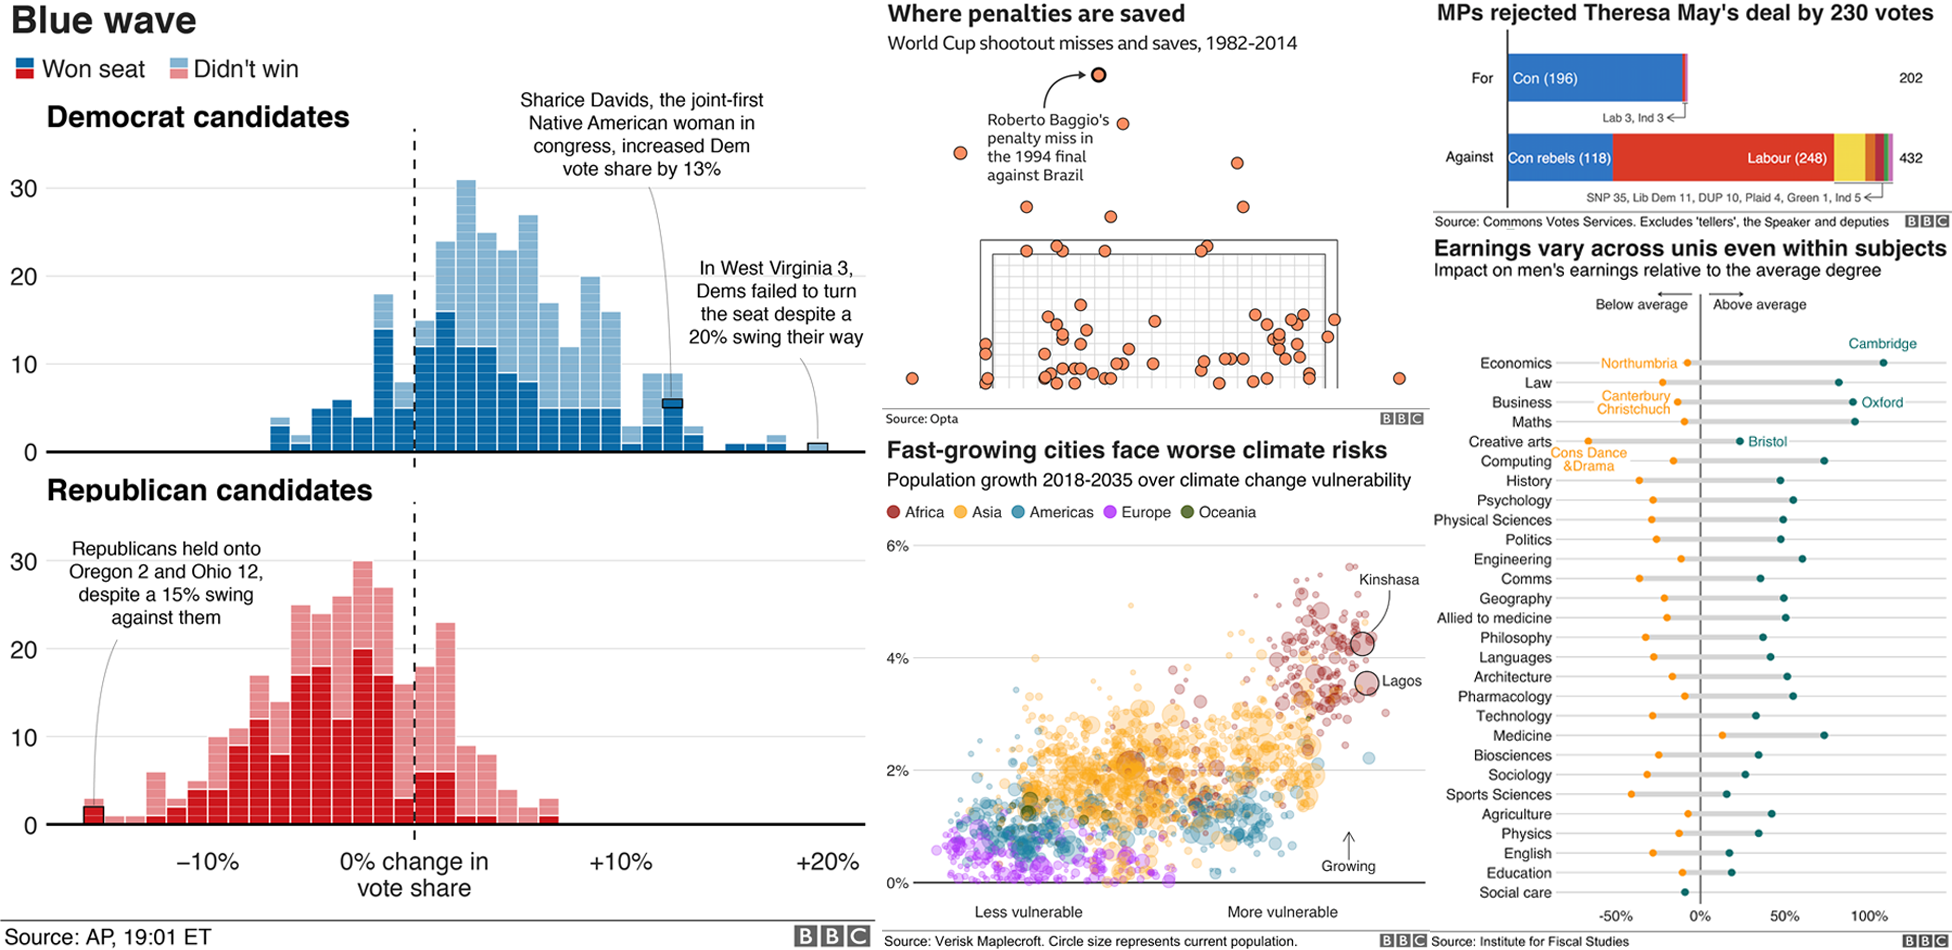
bbplot 패키지 예제 그래프

여기서 인상적인 부분을 짚어보겠다. 가장 왼쪽의 히스토그램을 보면 옅은 흰색 실선으로 자료의 해석을 보다 쉽게 해줬다는 것이다. 그래프에서 흰 실선은 검정 실선보다 눈에 띄지는 않지만 은근히 자료의 가독성을 높여주는데 히스토그램을 작은 네모를 적층(積層)한것 처럼 처리를 했으니 “참 많은 고민을 했구나.” 라는 생각을 하게 된다. 사실 고민도 고민이지만 코드로 구현하려면 보통 귀찮은 일이 아닌데 일단 좀 더 살펴보도록 하자.

축구 골대를 표현한 시각화의 경우는 그냥 보면 단순한 산점도 이지만, 데이터의 특성을 고려하여 독자의 이해를 보다 쉽게 하는 사례라고 할 수 있겠다.

나머지 그래프는 전반적으로 색상, 투명도의 적절한 사용. 그리고 군더더기 없는 보조 격자선과 깔끔하고 강약조절이 확실한 텍스트가 한몫 한다고 하겠다. 이 즈음 되면 과연 일반 사용자도 구현이 가능할지 의문인데 한 번 확인을 해보도록 하자.

설치

bbplot 패키지는 기본 install.packages() 함수로 설치가 안된다. 그래서 게시물 뱃지에 다운로드가 0이다. 향후 정식으로 cran에 등록이 된다면 집계되는 숫자를 볼 수 있을 것이다. 그리고 깃허브를 통해서 설치해야 하니 다음의 코드를 참고하자.

1
2
3
remotes::install_github("bbc/bbplot") # 1
devtools::install_github("bbc/bbplot") # 2
install.packages("bbplot") # 3

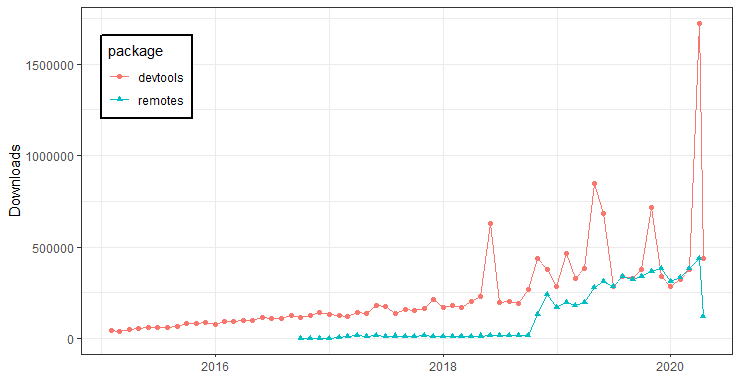
bbplot 패키지 의 공식 페이지에는 2번 코드로 예제가 나와있지만 remotes 패키지를 사용하는 1번 코드로 해도 관계없다. 아무래도 remotes 패키지가 범용성이 좋다보니 사용자가 점점 많아지는 것 같은데, 느낌만으로는 불충분하니 dlstats 패키지로 각 패키지 다운로드 숫자를 알아보면 다음과 같다.

1
2
3
4
5
6
7
8
9
10
11
12
13
14
15
library("ggplot2")
library("dlstats")

df = cran_stats(c("devtools", "remotes"))
ggplot(data = df,
aes(x = end,
y = downloads,
group = package,
color = package)) +
geom_line() +
geom_point(aes(shape = package)) +
labs(x = NULL, y = "Downloads") +
theme_bw() +
theme(legend.position = c(0.1, 0.8),
legend.background = element_rect(size = 1, color = "#000000"))

devtools와 remotes 패키지 다운로드 추이

통계적인 검증까지는 딱히 필요없을 것 같고 아무튼 아직 devtools를 훨씬 더 많이 쓰는 것 같다. 진짜 차이가 벌어지려면 최소 1년은 더 두고봐야 하지 않을까?

샘플 코드

본 포스팅을 작성한 시점 기준으로 공식 페이지에 있는 코드를 실행시켜보면 제대로 동작하지 않는다. 참고로 해당 코드는 다음과 같다.

1
2
3
4
line <- ggplot(line_df, aes(x = year, y = lifeExp)) +
geom_line(colour = "#007f7f", size = 1) +
geom_hline(yintercept = 0, size = 1, colour="#333333") +
bbc_style()

이 코드는 BBC 차트 스타일 가이드 문서에 나와있는 코드인데 완전한 코드는 다음과 같다.

1
2
3
4
5
6
7
8
9
10
11
12
library("gapminder") # line_df 데이터
library("dplyr") # 파이프 연산자
library("ggplot2")
library("bbplot")

line_df <- gapminder %>%
filter(country == "Malawi") # 1

line <- ggplot(line_df, aes(x = year, y = lifeExp)) +
geom_line(color = "#007f7f", size = 1) +
geom_hline(yintercept = 0, size = 1, color = "#333333") # 2
line

여기까지는 일반 ggplot2 패키지 그래프이다. 그리고 bbc_style() 을 적용하면 다음과 같다.

1
2
line + 
bbc_style() # 3

뭔가 이쁘게 나온 것 같지만 살짝 문제가 발생했다. bbplot 패키지가 기본 지정한 폰트가 있는듯 한데 필자의 환경에 해당 폰트가 설치가 되어있지 않아서 발생한 문제라고 추정이 된다. BBC측에서 안내하고 있는 bbc_style() 함수의 원문 및 세부내용을 확인해보자.

bbc_style(): has no arguments and is added to the ggplot chain after you have created a plot. What it does is generally makes text size, font and colour, axis lines, axis text and many other standard chart components into BBC style, which has been formulated together with the Visual Journalism design team.

bbc_style() 함수에는 인자가 없기 때문에 함수 내부에 별도의 값 입력이 필요없으며, 글자 크기나 색상 등 여러 설정을 일괄로 처리해서 최종적으로 BBC 저널리즘 디자인 팀이 작업한 것 처럼 만들어준다고 한다. 어쨌든 폰트 문제이니 함수를 뜯어보아야 하겠다. BBC 차트 스타일 가이드 문서에 소개된 bbc_style() 함수는 다음과 같다.

1
2
3
4
5
6
7
8
9
10
11
12
13
14
15
16
17
18
19
20
## function () 
## {
## font <- "Helvetica"
## ggplot2::theme(plot.title = ggplot2::element_text(family = font,
## size = 28, face = "bold", color = "#222222"), plot.subtitle = ggplot2::element_text(family = font,
## size = 22, margin = ggplot2::margin(9, 0, 9, 0)), plot.caption = ggplot2::element_blank(),
## legend.position = "top", legend.text.align = 0, legend.background = ggplot2::element_blank(),
## legend.title = ggplot2::element_blank(), legend.key = ggplot2::element_blank(),
## legend.text = ggplot2::element_text(family = font, size = 18,
## color = "#222222"), axis.title = ggplot2::element_blank(),
## axis.text = ggplot2::element_text(family = font, size = 18,
## color = "#222222"), axis.text.x = ggplot2::element_text(margin = ggplot2::margin(5,
## b = 10)), axis.ticks = ggplot2::element_blank(),
## axis.line = ggplot2::element_blank(), panel.grid.minor = ggplot2::element_blank(),
## panel.grid.major.y = ggplot2::element_line(color = "#cbcbcb"),
## panel.grid.major.x = ggplot2::element_blank(), panel.background = ggplot2::element_blank(),
## strip.background = ggplot2::element_rect(fill = "white"),
## strip.text = ggplot2::element_text(size = 22, hjust = 0))
## }
## <environment: namespace:bbplot>

Helvetica 함수를 사용하고 있으며 제법 다양한 theme() 함수 설정을 ggplot2 패키지 함수로 잡아주고 있다. 폰트의 경우에는 설치하고 적용하기 까다로운 경우가 많아서 초심자에게는 만만한 작업이 아니다. 그래서 폰트를 제외한 나머지만이라도 사용하고 싶다면 다음과 같이 작성하면 된다.

1
2
3
4
5
6
7
8
9
10
11
12
13
14
15
16
17
bbc_style2 = function(font = "Helvetica"){
ggplot2::theme(plot.title = ggplot2::element_text(family = font,
size = 28, face = "bold", color = "#222222"), plot.subtitle = ggplot2::element_text(family = font,
size = 22, margin = ggplot2::margin(9, 0, 9, 0)), plot.caption = ggplot2::element_blank(),
legend.position = "top", legend.text.align = 0, legend.background = ggplot2::element_blank(),
legend.title = ggplot2::element_blank(), legend.key = ggplot2::element_blank(),
legend.text = ggplot2::element_text(family = font, size = 18,
color = "#222222"), axis.title = ggplot2::element_blank(),
axis.text = ggplot2::element_text(family = font, size = 18,
color = "#222222"), axis.text.x = ggplot2::element_text(margin = ggplot2::margin(5,
b = 10)), axis.ticks = ggplot2::element_blank(),
axis.line = ggplot2::element_blank(), panel.grid.minor = ggplot2::element_blank(),
panel.grid.major.y = ggplot2::element_line(color = "#cbcbcb"),
panel.grid.major.x = ggplot2::element_blank(), panel.background = ggplot2::element_blank(),
strip.background = ggplot2::element_rect(fill = "white"),
strip.text = ggplot2::element_text(size = 22, hjust = 0))
}

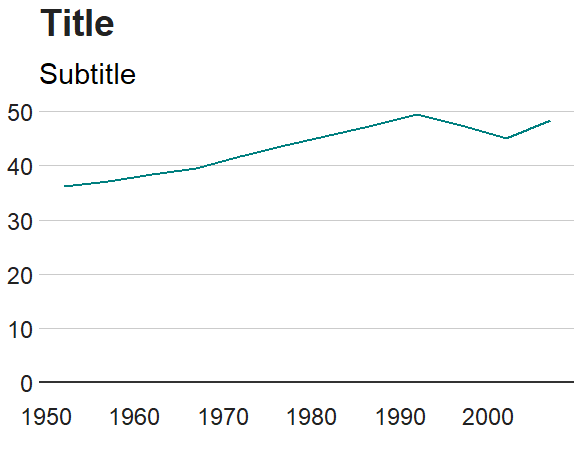
새로운 사용자 정의함수 bbc_style2()를 먼저 정의한 다음 다음과 같이 사용하면 된다.

1
2
3
4
line + 
labs(title = "Title",
subtitle = "Subtitle") +
bbc_style2(font = NULL)

bbc_style2() 로 그린 그래프

시스템의 기본 폰트를 사용하고 싶다면 NULL을 입력하면 되고 아니면 별도로 지정한 폰트명을 입력하면 된다. 나머지 그래프는 BBC 차트 스타일 가이드 문서를 차근차근 따라하면 되겠다.

그런데 왜 이쁜 히스토그램은 안보이는지…
Your browser is out-of-date!

Update your browser to view this website correctly. Update my browser now

×